Wednesday 21 October 2015

Toronto Maple Leafs - Time for a Reality Check

It’s slightly more than half-way through October and even though the season has barely started, there is still a lot of chatter in Leafs Nation about why more of the “rotten core” hasn’t been moved out to make way for the youngsters down with the Marlies.


For those of you who don’t live and breathe Blue & White, or simply have relegated the Leafs to a distant second after the Blue Jays (Let’s Go Blue Jays!), let’s define who comprises this “rotten core”. Most Leafs fans would agree that the “rotten core” is made up of the following players:

  1. Tyler Bozak
  2. Joffrey Lupul
  3. Dion Phaneuf


As the list is only comprised of 3 players, most of Leafs Nation is wondering – if the new management group is so committed to a rebuild, what’s taking them this long to move this “rotten-core” out?

As the business of professional hockey is by no means simple, that means there are no simple answers to that very simple question.

The first obvious answer – at the moment no one wants them!

If that’s not enough of an answer, then we’ll need to look at recent moves by other organizations in the NHL. Starting last year with the high-profile waiving by the Kings of Mike Richards to the A.H.L. and followed up this year by the waiving to the A.H.L. of Andrew MacDonald by the Flyers and Daniel Cleary by the Red Wings, it seems teams are no longer willing to carry what they see as “dead-weight” salaries against the salary cap. Not good news if you’re the Leafs and you’re trying to unload guys being paid $4.2, $5.25, and $7.0 million against the salary cap for the next 3, 3, and 6 years respectively. Yikes!

After the tire fire which ended their 2014/15 season, realistically the best that can be hoped for by the new management team of the Leafs, and Leafs Nation for that matter, is that Mike Babcock will be able to “rehabilitate” the perceived “poor” play of the previously mentioned “rotten-core” and make them tradeable at some point in the future – hopefully later this season at the trade deadline.

Even though the new season is only five games old for the Leafs, the results so far seem promising. Dion Phaneuf is tied for the team lead with 4 points. Tyler Bozak (once) and Joffrey Lupul (twice) have both hit the back of the net, and more importantly, Lupul has managed to stay injury free! If this level of injury luck and offensive production can be maintained until the trade deadline at the end of February 2016, the Leafs might be able to unload two (Bozak & Lupul) of the three as depth players for teams hoping to make a deep push into the playoffs. Similar to the Phil Kessel trade, both of these players have limited no-trade clauses and this could complicate matters somewhat.

Dion Phaneuf will present more of a challenge as he has a relatively high cap hit ($7.0 million) and extended term (6 years) still left on his deal. It’s almost a foregone conclusion that if the Leafs are to trade Phaneuf, they are going to have to take back either a similarly “bad” contract (but hopefully on a shorter term) and/or absorb some of the $7.0 million cap hit. Complicating Phaneuf’s situation is his no-movement clause.

What’s the reality check alluded to in this article’s headline?

Leafs Nation - be prepared for all three of this so-called “rotten-core” to be Maple Leafs for the duration of each of their contract’s term. For Bozak and Lupul, that is two more seasons after this one – a time-frame the Leafs can probably live with as no one is expecting them to be serious contenders before that time. Phaneuf’s term of five more seasons after this one could present a challenge as he is already on the wrong side of 30 and realistically projects to hit rapid decline in his play over the next 3-4 years – a potentially bad time-frame coinciding with when the Leafs are hoping to at least become contenders.

What are the take-aways from this whole “rotten-core” situation?

  1. No more over-paying, in either dollars or term, for border-line players.
  2. No more no-trade or no-movement clauses.


If the Leafs can somehow manage to wiggle out from under even one of these “rotten-core” contracts during this season, it should definitely be seen as a major positive. Wiggle out from under two or even all three? The new management team will have earned huge bonuses!


Monday 21 September 2015

Toronto Maple Leaf Scouting - Good or Bad? Toronto vs. Chicago

After the previous article in this series (Toronto Maple Leaf Scouting – Good or Bad? Toronto vs. Detroit), hopefully there has been a change in the perceived notation in Leafs Nation that the drafting of their beloved Leafs has been abysmal over the past decade or so. It should be noted that this period of time roughly corresponds to when Dave Morrison was Director of Amateur Scouting for the Toronto Maple Leafs.

The new management group of the Toronto Maple Leafs has stated that their goal is to rebuild into a perennial Stanley Cup contending team. To do that, in today’s NHL, the two main areas that must be improved upon are drafting and development.

As drafting was the first item of business that came up after the end of the last season (2014/15), it should be interesting to compare the draft history of the Maple Leafs to some of the other NHL teams who are perceived to have had strong drafting records. To keep the scope of this comparison focused, we will concentrate on the drafts from the years starting in 2006 – the year Dave Morrison was appointed Director of Amateur Scouting for the Maple Leafs.

Looking around the NHL, the one team who has had recent success in the ultimate goal of actually winning Stanley Cups is the Chicago Blackhawks. After each season (2010, 2013, and 2015) when they have won the Stanley Cup the Blackhawks have had to dismantle a good chunk of their team to be able to remain compliant under the salary cap. Each time they have had to do this, they have been able to reach down into their farm system and pluck a player or two who has played a significant role in a future Cup win. The sheer fact that the Blackhawks have been able to do this must speak volumes about the quality of their drafting. This being the case, let’s compare the Blackhawk’s drafting record to the drafting record of the Leafs during the years from 2006 to 2011.

There is one major caveat that has to be acknowledged before we go any further with this analysis – we do not know, and probably never will know, who had the final say in choosing the Leaf's draft picks since 2006 – was it strictly the call of Dave Morrison or were any of his recommendations overridden by others in the ranks of Leafs management?

To start, let’s look at a chart showing all the players drafted by the Leafs since 2006. But first, an explanation of what each of the columns means:


  1. Current Team – NHL team owning that player’s rights. If blank, player is still with the Leafs.
  2. Draft Yr / Round – NHL Entry Draft Year and Round number.
  3. Overall Pick – Within each Round, Leafs’ draft position. If red, Leafs didn’t have pick. If yellow, Leafs had extra pick.
  4. Player – Name of player Leafs picked.
  5. P o s – Position drafted player plays. 
  6. Total NHL Games Played – Total number of NHL games player has played by end of 2014/15 season.
  7. NHL Games for TML – Total number of NHL games player has played for Leafs by end of 2014/15 season.
  8. Difference – Difference between 6 and 7.
  9. NHL Games Post Draft – Total number of NHL games after NHL Entry Draft year.
  10. Super Aggressive NHL Games – Total number of games a player should have played if they were on a super aggressive path to the NHL. i.e. Played in NHL next year after being drafted. An ‘x’ in this column indicates that the player followed this path to the NHL.
  11. Aggressive NHL Games – Total number of NHL games a player should have played if they were on an aggressive path to the NHL. i.e. Played in NHL 2nd year after being drafted. (Draft + 1). An ‘x’ in this column indicates that the player followed this path to the NHL.
  12. Conservative NHL Games - Total number of NHL games a player should have played if they were on a conservative path to the NHL. i.e. Played in NHL 3rd year after being drafted. (Draft + 2). An ‘x’ in this column indicates that the player followed this path to the NHL.
  13. Ultra Conservative NHL Games - Total number of NHL games a player should have played if they were on an ultra conservative path to the NHL. i.e. Played in NHL 4th year after being drafted. (Draft + 3). An ‘x’ in this column indicates that the player followed this path to the NHL.


There’s a few interesting points which jump out immediately from the above chart:


  1. This chart covers a total of 9 years and in those 9 years (each with 7 rounds), there was a total of 63 draft picks that each NHL team would have been given.
  2. The Leafs actually made 61 picks out of the total of 63 picks available to them.
  3. By the end of the 2014/15 season, of the 61 picks the Leafs made, 23 have gone on to play in the NHL.
  4. Of those 23 that have played NHL games, 20 of them have played for the Leafs.
  5. The Super Aggressive path has been followed with only one player – Luke Schenn.
  6. The Aggressive path has been followed with three players, Jiri Tlusty, Nazem Kadri, and Morgan Rielly.
  7. The Conservative path has been followed with two players – Nikolay Kulemin and Carl Gunnarsson.
  8. The Ultra Conservative path has been followed with the vast majority of players – fourteen.
  9. There are a lot of Red boxes (15) in the Overall Pick column. This indicates where the Leafs did NOT have a pick in a particular round.
  10. There are a lot of Yellow boxes (13) in the Overall Pick column. This indicates where the Leafs had an EXTRA pick in a particular round.


The perception of the Leafs’ draft record, to a casual fan, for the past 9 years certainly would have included the idea that the Leafs were hobbled in their drafting by the notion that they had traded away a lot of their picks. But as shown, the Leafs still made 61 picks out of a possible total of 63. The Leafs did trade away a lot of picks (15), but they also acquired a lot of picks (13) in trades with other teams. Of course, a lot of pressure was placed on the scouting staff when 1st and 2nd round picks were traded away and replaced, for the most part, with picks in the 5th, 6th, or 7th rounds.

As the Leafs have followed the Ultra Conservative approach with the vast majority of their players, any attempt to quantify the quality of the Leafs draft picks should only include players drafted from the years 2006 to 2011. Looking at those years, the Leafs drafted a total of 44 players, 22 of which went on to play games in the NHL –a 50% success rate. Eliminating anyone who did not play an NHL game for the Leafs leaves 19 players – approximately a 43% success rate. Would these rates be considered bad or good? Only comparisons to the records of other teams will shed any light on that question.

In that vein, let’s compare the Leafs’ record versus the record for the Chicago Blackhawks. Here’s the Blackhawk’s chart covering the same years as the Leafs’ chart above:


There’s a few interesting points which jump out immediately from Chicago’s chart above:


  1. This chart covers a total of 9 years and in those 9 years (each with 7 rounds), there was a total of 63 draft picks that each NHL team would have been given.
  2. The Blackhawks actually made 77 picks out of the total of 63 picks available to them.
  3. By the end of the 2014/15 season, of the 77 picks the Blackhawks made, 21 have gone on to play in the NHL.
  4. Of those 21 that have played NHL games, 17 of them have played for the Blackhawks.
  5. The Super Aggressive path has been followed with two players – Patrick Kane & Andrew Shaw.
  6. The Aggressive path has been followed with three players – Jonathan Toews & Brandon Saad.
  7. The Conservative path has been followed with four players.
  8. The Ultra Conservative path has been followed with eight players.
  9. There are a few Red boxes (8) in the Overall Pick column. This indicates where the Blackhawks did NOT have a pick in a particular round.
  10. But there are A LOT of Yellow boxes (22) in the Overall Pick column. This indicates where the Blackhawks had an EXTRA pick in a particular round.
To a casual fan, the perception of the Blackhawks draft record for the past 9 years would have included the notion that the Blackhawks had drafted OK but had been lucky enough to secure a top 3 pick and follow that up the next year (2007) with a win of the Draft Lottery and the 1st overall pick. With two rather healthy doses of luck, the Blackhawks were able to secure Jonathan Toews and Patrick Kane respectively. Putting aside this lucky aspect for a moment, the Blackhawks made 77 picks out of a possible total of 63 – quite a few (16) more than the Leafs. The Blackhawks did trade away a few picks (8) but more than made up for those by acquiring a lot of picks (22) in trades with other teams. Unlike the Leafs, the Blackhawks did NOT place a lot of pressure on their scouting staff by trading away higher round (1st, 2nd, and 3rd)  picks and replacing them with lower round (5th, 6th, and 7th) picks.

In looking at the Blackhawks' “model”, it is apparent they allowed their draft picks to play at the NHL level when they were ready – no extra years of “baking” them in junior or in the AHL as per the Detroit “model”. This makes quantifying the quality of the Blackhawks draft picks a little more difficult but to make the comparison with the Leafs a little simpler, only the players drafted from the years 2006 to 2011 will be included. Looking at those years, the Blackhawks drafted a total of 52 players, 21 of which went on to play games in the NHL –approximately a 40% success rate. Eliminating anyone who did not play an NHL game for the Blackhawks leaves 17 players – approximately a 33% success rate.

OK, now that there are some basic numbers to compare, let’s see how the Leafs’ drafting has stood up against the defending Stanley Cups champion Chicago Blackhawks. Here’s a chart showing a simple breakdown of the numbers:


As both teams mostly follow the Ultra Conservative path for their players, the chart above does a comparison of the drafting record for each team from the year 2006 up to and including the year 2011 – if they are following an Ultra Conservative path, any players drafted in 2012, 2013, or 2014 should not be playing in the NHL. In the case of the Leafs, we have removed Morgan Rielly from the numbers above as he was drafted in 2012.

Once again, the chart above blows away quite a few of the misconceptions concerning the drafting record of the Leafs.

  1. For the time period in question, the Leafs had fewer draft picks than the Blackhawks – 44 vs. 52.
  2. Of each team’s respective picks, a substantially higher percentage of the Leafs picks have gone on to play in the NHL – 50% vs. 40%.
  3. Of each team’s respective picks, a substantially higher percentage of the Leafs picks have gone on to play in the NHL for the Leafs – 43% vs. 33%.


Supporters of the Blackhawk’s draft record would attempt to counter the chart above by saying that the quality of the Blackhawk’s draft picks far surpassed the Leafs’ draft picks. Of course, this is true. It would be hard to argue that over the 2006 to 2011 time period the Leafs have drafted any players who would stack up favourably to a Jonathan Toews or Patrick Kane. Supporters of the Leafs would counter by pointing out that the Leafs did NOT have the benefit of having the 1st and 3rd overall draft picks. The highest the Leafs drafted in the 2006 to 2011 time frame would be 5th and 7th overall. As everyone knows, the quality of each draft varies widely after the first 2 to 4 picks.

Perhaps the Hawks drafting superiority can be found in the total number of NHL games their drafted players have played?


How about the total number of NHL games each team’s drafted players have played for them?


How about the total number of NHL games each team’s drafted players have played for other teams?


OK, now we’ve found something.

But the chart above does NOT speak to the drafting record of the Leafs. Instead, it says volumes about the development record of the Leafs. A topic that’ll be looked at in detail in subsequent articles.

One final way to compare the drafting record of the Blackhawks and the Leafs would be to look at the top-5 players each team has drafted. Here’s the Blackhawk’s list ranked by Total NHL Games Played.


That’s a pretty solid list, led by the 1st and 3rd overall picks of Patrick Kane and Jonathan Toews. This group has a combined total of 1880 NHL games played.

A couple of interesting points jump out from that list. First, all these players have played all their games for the Blackhawks – this will change this upcoming season as the Blackhawks dealt Brandon Saad to the Columbus Blue Jackets. Second, there are a couple of later round (5th) gems in that bunch – Marcus Kruger and Andrew Shaw.

Here’s the Leafs’ list ranked by Total NHL Games Played. Since he is a goalie, James Reimer has been thrown in as an extra bonus for the Leafs.


What a difference. This group has a combined total of 1716 NHL games played (excluding James Reimer).

Leafs supporters will attempt to explain away the underwhelming list above by saying that the Leafs did not have the benefit of a 1st and 3rd overall draft pick. True enough, but that argument is somewhat undermined by the fact that the Leafs did have a 5th and 7th overall draft pick. As well, the latest draft year from which the Leafs players were taken was 2009, in contrast to the Blackhawks who took two of their listed players in the 2011 draft.

Interesting points from the Leafs list? On the bright side, like the Blackhawks the Leafs were also able to reach into the later rounds to pluck out a couple of decent players – Carl Gunnarson and Leo Komarov. But this is overshadowed by the fact that Carl Gunnarson and their other “top-2” players all play for different teams now!

On the surface, it seems that the Leafs’ drafting record stacks up very favourably versus the Blackhawk's drafting record. Scratching that surface though reveals that the quality of the players drafted by the Leafs does not stack up favourably against the Blackhawks. Some of this can be explained away by the Leafs not having a 1st and 3rd overall pick. Some of it can be explained away by the Leafs not having a pick in a deep 2010 draft until the 2nd round or a pick in the equally deep 2007 draft until the 3rd round! But none of those explanations can explain away all the discrepancies. In this case, it seems that the Leafs’ amateur scouting department and its former head, Dave Morrison, was out-drafted by the Chicago Blackhawks.


All numbers courtesy www.hockeydb.com

Wednesday 2 September 2015

The Toronto Maple Leafs and Steven Stamkos

As each day passes without Steven Stamkos signing an extension with the Tampa Bay Lightning, the speculation in Leafs Nation grows that perhaps he might actually become a free agent and suit up for the Toronto Maple Leaf to start the 2016/2017 season.

Whether Steven Stamkos will become a free agent or even whether he wants to become a Toronto Maple Leaf is irrelevant to this article. The relevant point is whether the Toronto Maple Leafs should even pursue Steven Stamkos if he becomes a free agent after the 2015/2016 season.


To make that decision, it might help to do a simple chart of the pros and cons.


It has to be assumed that Stamkos and his team are looking for a “max” contract (8 years) with at least comparable dollars ($10.5 million) to the Toews and Kane extensions. That equates out to $84 million over eight years. 

Looking at the last con point from a Lightning perspective, they already have $48.535 million committed to 14 players for the 2016/2017 season. After adding in a Stamkos contract at the bargain-basement rate of $10.5 million/season, the salary cap number becomes $59.035 million for 15 players. Assuming the salary cap rises to approximately $74 million by the start of the 2016/2017 season – that would give Tampa approximately $15 million to add 8 more players to their roster – a difficult but not impossible proposition.

Complicating the difficult (but not impossible!) situation above is the fact that at the end of this coming season (2015/2016) the Lightning will have 5 players who will be Restricted Free Agents (RFAs) – Alex Killorn, J.T. Brown, Vladislav Namestnikov, Nikita Kucherov, and Cedric Paquette. All 5 of those names played in last season’s playoffs – 4 of them playing most, if not all, of the games. At the end of the 2015/2016 season, in addition to Stamkos, there will be 1 other Unrestricted Free Agent (UFA) who also played all of Tampa’s playoff games last season – Braydon Coburn. As 5 of these 6 players were relied upon to make contributions during Tampa’s long playoff run to the Stanley Cup finals last season, presumably retaining their services would be a desirable outcome for Tampa. In that scenario, assuming all 5 players would be looking for healthy raises, Tampa could find themselves very close to the salary cap with another 3 players still needed to fill out their roster. The difficulty rating has just risen a notch or two.

Looking ahead to the end of the 2016/2017 season, 5 of Tampa’s key players for the future – Tyler Johnson, Ondrej Palat, Andrej Sustr, Andrej Vasilevsky, and Victor Hedman are scheduled to become RFAs or UFAs. The difficult situation from the end of the 2015/2016 season has likely become an almost impossible proposition.

Being the astute G.M. that he has proven himself to be, no doubt Steve Yzerman and his crack team have been running through these scenarios (and more!) since the end of Tampa’s season. The two difficult scenarios they likely keep finding themselves in are the scenarios where they keep Steven Stamkos and risk losing some of their younger core players, or they lose Steven Stamkos in the hopes of being able to keep their younger core players.

As the second scenario has the most interest for Maple Leaf fans, let’s take a closer look at that one.

Up front, let’s dismiss the notion that Steve Yzerman is going to be able to trade Steven Stamkos and get back anything of value. After all, which G.M. is going to offer more than a bag-o-pucks in a trade for Stamkos when he knows full well that if Stamkos hasn’t signed a contract extension up to the point when he’s traded, Stamkos is going home to Toronto. In this scenario, in a strange way, it almost makes sense for Yzerman to keep Stamkos and hope that with him the Lightning can win the Stanley Cup they came oh-so-close to winning last season. Not sure how well the ownership group in Tampa would react to losing Stamkos for nothing, but everyone getting their picture taken around the Cup might help alleviate the sting a bit!

With the above situation front-of-mind, you can believe that Brendan Shanahan and his crack team have also been running through scenarios to see if it would make sense to pursue Steven Stamkos if he was to become a free agent at the end of the 2015/2016 season.

No matter the different scenarios that are run or the ways it is approached, the main sticking point for the Leafs should be the last con point – he’ll be expensive. If Stamkos was to become a free agent and look to join the Leafs, the longest term contract the Leafs could offer him would be 7 years. Taking the conservative estimate above of $10.5 million/year over 8 years (or $84 million), the Leafs would have to give Stamkos $12 million/year over 7 years just to MATCH that offer!

Don’t get me wrong. Stamkos is a great player and would certainly go a long way towards getting the Leafs’ rebuild on the rails and heading down the tracks in the right direction – but is he really worth $12 million/year? Or more accurately, can the Leafs afford to tie up that much money in 1 player for 7 years? Wouldn’t the Leafs find themselves in the same conundrum that the Tampa Bay Lightning find themselves in now?

Of course, until such time as the G.T.A. born Stamkos signs a contract extension with Tampa, the speculation in Leafs Nation will run rampant, but for the Toronto Maple Leafs, it should definitely be a buyer-beware situation.

Friday 7 August 2015

Toronto Maple Leaf Scouting - Good or Bad? Toronto vs. Detroit

There has been a perceived notation in Leafs Nation that the drafting of their beloved Leafs has been abysmal over the past decade or so – a period of time that roughly corresponds to when Dave Morrison was Director of Amateur Scouting for the Toronto Maple Leafs.

As part of their stated goal to rebuild into a Stanley Cup contending team, the new management group of the Toronto Maple Leafs have stated that drafting and development are two of the most important aspects of this rebuild.

As drafting is the first part of the new management group’s mantra, it might be interesting to compare the draft history of the Maple Leafs to some of the other NHL teams who are perceived to have had strong drafting records. To keep the scope of this comparison focused, we will concentrate on the drafts from the years starting in 2006 – the year Dave Morrison was appointed Director of Amateur Scouting for the Maple Leafs.

Looking around the NHL, the one team most fans would agree that appears to have had an exemplary drafting record would be the Detroit Red Wings. In fact, as most fans would consider the Wings the gold standard when it comes to drafting, let's analyze their drafting record and compare it to the drafting record of the Leafs during the years from 2006 to 2014.

Before we go any further with this analysis, there is one major caveat that has to be acknowledged - we don't know, and probably never will know, who had the final say in choosing the Leaf's draft picks since 2006 – was it strictly the call of Dave Morrison or were any of his recommendations overridden by others in the ranks of Leafs management?

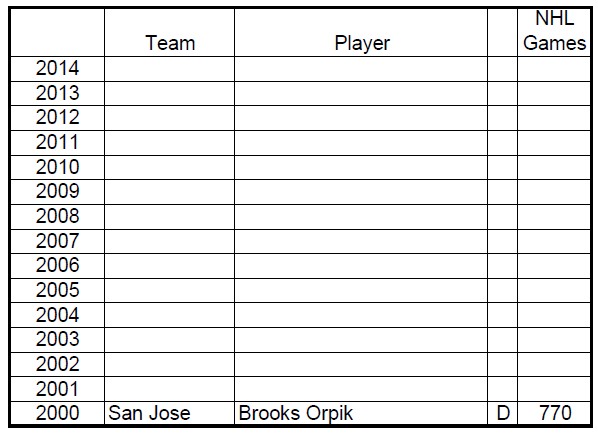
To start, let’s look at a couples of charts showing all the players drafted by the Leafs since 2006. But first, an explanation of what each of the columns means:

1.      Current Team – NHL team owning that player’s rights. If blank, player is still with the Leafs.
2.      Draft Yr / Round – NHL Entry Draft Year and Round number.
3.      Overall Pick – Within each Round, Leafs’ draft position. If red, Leafs didn’t have pick. If yellow, Leafs had extra pick.
4.      Player – Name of player Leafs picked.
5.      P o s – Position drafted player plays.
6.      Total NHL Games Played – Total number of NHL games player has played by end of 2014/15 season.
7.      NHL Games for TML – Total number of NHL games player has played for Leafs by end of 2014/15 season.
8.      Difference – Difference between 6 and 7.
9.      NHL Games Post Draft – Total number of NHL games after NHL Entry Draft year.
10.   Super Aggressive NHL Games – Total number of games a player should have played if they were on a super aggressive path to the NHL. i.e. Played in NHL next year after being drafted. An ‘x’ in this column indicates that the player followed this path to the NHL.
11.   Aggressive NHL Games – Total number of NHL games a player should have played if they were on an aggressive path to the NHL. i.e. Played in NHL 2nd year after being drafted. (Draft + 1). An ‘x’ in this column indicates that the player followed this path to the NHL.
12.   Conservative NHL Games - Total number of NHL games a player should have played if they were on a conservative path to the NHL. i.e. Played in NHL 3rd year after being drafted. (Draft + 2). An ‘x’ in this column indicates that the player followed this path to the NHL.
13.   Ultra Conservative NHL Games - Total number of NHL games a player should have played if they were on an ultra conservative path to the NHL. i.e. Played in NHL 4th year after being drafted. (Draft + 3). An ‘x’ in this column indicates that the player followed this path to the NHL.


There’s a few interesting points which jump out immediately from the above charts:

1. A total of 9 years are covered and in those 9 years (each with 7 rounds), there was a total of 63 draft picks that each NHL team would have been given.
2. The Leafs actually made 61 picks out of the total of 63 picks available to them.
3. By the end of the 2014/15 season, of the 61 picks the Leafs made, 23 have gone on to play in the NHL.
4. Of those 23 that have played NHL games, 20 of them have played for the Leafs.
5. The Super Aggressive path has been followed with only one player – Luke Schenn.
6. The Aggressive path has been followed with three players, Jiri Tlusty, Nazem Kadri, and Morgan Rielly.
7. The Conservative path has been followed with two players – Nikolay Kulemin and Carl Gunnarsson.
8. The Ultra Conservative path has been followed with the vast majority of players – fourteen.
9. There are a lot of Red boxes (15) in the Overall Pick column. This indicates where the Leafs did NOT have a pick in a particular round.
10. There are a lot of Yellow boxes (13) in the Overall Pick column. This indicates where the Leafs had an EXTRA pick in a particular round.

To a casual fan, the perception of the Leafs draft record for the past 9 years would certainly have included the idea that the Leafs were hobbled in their drafting by the notion that they had traded away a lot of their picks. But as shown, the Leafs still made 61 picks out of a possible total of 63. The Leafs did trade away a lot of picks (15), but they also acquired a lot of picks (13) in trades with other teams. Of course, a lot of pressure was placed on the scouting staff when 1st and 2nd round picks were traded away and replaced, for the most part, with picks in the 5th, 6th, or 7th rounds.

As the Leafs have followed the Ultra Conservative approach with the vast majority of their players, any attempt to quantify the quality of the Leafs draft picks should only include players drafted from the years 2006 to 2011. Looking at those years, the Leafs drafted a total of 44 players, 22 of which went on to play games in the NHL –a 50% success rate. Eliminating anyone who did not play an NHL game for the Leafs leaves 19 players – approximately a 43% success rate. Would these rates be considered bad or good? Only comparisons to the records of other teams will shed any light on that question.

In that vein, let’s compare the Leafs’ record versus the record for the Detroit Red Wings. Here’s the Wing’s charts covering the same years as the Leafs’ chart above:


There’s a few interesting points which jump out immediately from Detroit’s charts above:

1. A total of 9 years are covered and in those 9 years (each with 7 rounds), there was a total of 63 draft picks that each NHL team would have been given.
2. The Wings actually made 62 picks out of the total of 63 picks available to them.
3. By the end of the 2014/15 season, of the 62 picks the Wings made, 20 have gone on to play in the NHL.
4. Of those 20 that have played NHL games, 18 of them have played for the Wings.
5. The Super Aggressive path has been followed with ZERO players.
6. The Aggressive path has been followed with ZERO players.
7. The Conservative path has been followed with two players – Tomas Jurco and Xavier Ouellet.
8. The Ultra Conservative path has been followed with the VAST majority of players – sixteen.
9. There are a lot of Red boxes (11) in the Overall Pick column. This indicates where the Wings did NOT have a pick in a particular round.
10. There are a lot of Yellow boxes (10) in the Overall Pick column. This indicates where the Wings had an EXTRA pick in a particular round.

To a casual fan, the perception of the Wings draft record for the past 9 years would certainly have included the notion that the Wings hoarded their picks and even went so far as to accumulate excess picks. But as shown, the Wings made 62 picks out of a possible total of 63 – only one more pick than the Leafs. The Wings also did trade away a lot of picks (11), but they also acquired a lot of picks (10) in trades with other teams. Like the Leafs, the Wings also placed a lot of pressure on their scouting staff by trading away quite a few 1st and 2nd round picks. But unlike the Leafs, the Wings mostly replaced the picks they traded away with picks in the 2nd or 3rd rounds.

As the Wings have very clearly followed the Ultra Conservative approach with the vast majority of their players, any attempt to quantify the quality of the Wings draft picks should only include players drafted from the years 2006 to 2011. Looking at those years, the Wings drafted a total of 41 players, 20 of which went on to play games in the NHL –approximately a 48% success rate. Eliminating anyone who did not play an NHL game for the Wings leaves 18 players – approximately a 44% success rate. 

OK, now that there are some basic numbers to compare, let’s see how the Leafs' drafting has stood up against the drafting dynamo known as the Detroit Red Wings. Here’s a chart showing a simple breakdown of the numbers:


As both teams mostly follow the Ultra Conservative path for their players, the chart above does a comparison of the drafting record for each team from the year 2006 up to and including the year 2011 – if they are following an Ultra Conservative path, any players drafted in 2012, 2013, or 2014 should not be playing in the NHL. In the case of the Leafs, we have removed Morgan Rielly from the numbers above as he was drafted in 2012.

On the surface, the chart above blows away quite a few of the misconceptions concerning the drafting record of the Leafs.

1. During the time period in question, the Leafs had more draft picks than the Wings – 44 vs. 41.
2. Of each team’s respective picks, a higher percentage of the Leafs picks have gone on to play in the NHL – 50% vs. 48%.
3. Of each team’s respective picks, a slightly smaller percentage of the Leafs picks have gone on to play in the NHL for the Leafs – 43% vs. 44%. Though the actual number (19) is higher than the Wings number (18).

Supporters of the Wing’s draft record would attempt to counter the chart above by saying that the Leafs had more picks (44) to the Wings (41) therefore that would explain why the Leafs percentages are basically the same or just slightly higher. Of course, this is true, the Leafs did have an extra three picks – but with those extra three picks, the Leafs managed to draft an extra two players who did play an NHL game. As well, the Leafs also managed to draft an extra player would did play at least one NHL game for them. Either of those two scenarios is quite remarkable in its’ own right.

Perhaps the Wings drafting superiority can be found in the total number of NHL games their drafted players have played?


How about the total number of NHL games each team’s drafted players have played for them?


How about the total number of NHL games each team’s drafted players have played for other teams?


OK, now we’ve found something. 

But the chart above does NOT speak to the drafting record of the Leafs. Instead, it says volumes about the development record of the Leafs. A topic that’ll be looked at in detail in subsequent articles.

As can be seen from the various comparisons above, the Leafs’ drafting record stacks up very favourably versus the Wings’ drafting record. Perhaps the Leafs’ amateur scouting department and its former head, Dave Morrison, have been unfairly maligned over the past 9 years?

Tuesday 2 June 2015

Protected Draft Territory - Summary for the Years 2000 to 2014 - Part 3

With the completion of the fifteenth and last article (Protected Draft Territory – Alternate Draft History for the Year 2014) in the series describing the results of implementing a Protected Draft Territory (P.D.T.) for each NHL team and the alternate history for the NHL Entry Drafts that would have resulted, it is now possible to summarize the results and look at whether my suggested solution to rectify the problems with the NHL Entry Draft is a viable one.


In Parts 1 and 2 of this series, we saw how the first 20 teams could have fared under the P.D.T. Some teams would have done very well (Toronto), some teams would have done OK, and some teams would not have done so well. In this article, we’ll turn our attention to the bottom 10 teams (starting with Pittsburgh) and their results. Looking at Table 1 below things seem to go from bad to worst.

Table 1.

Picking up with the 21st team in the above table, Pittsburgh would have been able to designate a total of two players under their P.D.T. Two players out of a possible fifteen in what most would consider an area of the U.S. conducive to hockey. Here are those two players:


Table 2.

Even though the number (two) is quite low, the quality is pretty high – a solid NHL’er with a long career and a goalie who just might be the next phenom between the pipes.

Looking at the results for the 22nd team from Table 1. above, it is apparent that the St. Louis Blues would still be waiting to determine how they would be doing under the P.D.T.:

Table 3.

But, the trend seems to be favouring St. Louis as well since they would have been able to designate two players in the past five years under their P.D.T. umbrella.

Looking at the results for the 23rd team from Table 1. above, it is apparent that Carolina’s results would be considered pretty bad:

Table 4.


Being able to designate one player under their P.D.T. in fifteen years? The only positive thing that can be said from those results is that at least the one player was designated within the past two years.

Looking at the results for the 24th team from Table 1. above, it is apparent that the jury would still be out on Los Angeles’ P.D.T. picks:

Table 5.

On the positive side, at least the one player designated under the P.D.T. was done so within the past two years.

Looking at the results for the 25th team from Table 1. above, it is readily apparent that San Jose would have fared extremely poorly under the P.D.T.:

Table 6.

Even though their one player designated under their P.D.T. has, and continues to have, a very solid NHL career, only one player out of fifteen possible players shows that even with success in the regular season and playoffs, grass roots hockey in the San Jose area seems to need a helping hand.

Looking at the results for the 26th thru 30th teams from Table 1. above, it is apparent that the non-traditional hockey markets of Sunrise Florida (Panthers), Nashville (Predators), and Tampa Bay (Lightning) would all need a helping hand to try and encourage grass roots hockey to develop in their local areas. 

What is more surprising, two markets that should be conducive to hockey (Philadelphia and Washington) would have had the same results under the P.D.T. as the non-traditional markets:

Table 7.

Looking at the results presented in this article from the bottom 10 NHL teams, it is not surprising to see markets that are not traditionally conducive to hockey (Carolina, Los Angeles, San Jose, Florida, Nashville, and Tampa Bay) would have fared extremely poorly under the P.D.T. But at least for a couple of those non-traditional markets, the results are at least trending in the right direction – up.

What was the most surprising aspect to this series of articles was that markets that would traditionally be seen as conducive to hockey (Pittsburgh, St. Louis, Philadelphia, and Washington) had extremely poor to abysmal results under the P.D.T.

The obvious question  – what could be done to improve the results of the teams who would have fared poorly under the P.D.T.? In this case, poorly would be defined to be any team not having players designated under their P.D.T. for the majority (eight) of the fifteen years. Which by definition would be 20 of the 30 NHL teams.

If this question had been asked back in 1999, the expectation would have been that whatever measures were adopted to help the teams expected to have poor results under the P.D.T., these measures could have been implemented, modified, and then gradually phased out over the course of anywhere from five to twenty years.

To help ease the introduction of the P.D.T., for the first five years, the first rule implemented could have been to allow teams without a player designated under their P.D.T. to designate a player from another team’s P.D.T..

After the P.D.T. had been phased in for five years, the first modification of the rules covering the next ten years (years 6 to 15) could have seen teams no longer able to designate a player from another team’s P.D.T. Instead, the teams without a player under their P.D.T. would be given a secondary pick, in the same order they finished in the NHL Entry Draft, at the end of the first round of the draft.

After the P.D.T. had been in place for fifteen years, the second modification of the rules covering the next ten year period (years 16 to 25), could have seen teams without a player under their P.D.T. given a secondary pick, in the same order they finished in the NHL Entry Draft, at the end of the second round of the draft.

After the P.D.T. had been in place for twenty-five years, the third modification of the rules could have been to simply remove any help for the teams without a player designated under their P.D.T. as it could be argued that twenty-five years is more than enough time for teams to help found (if need be), nurture, and grow grass-roots hockey in the area around their location.

Remember, the ultimate goal of the P.D.T. is to encourage teams to grow grass-roots support for hockey in their local areas. In this way the long-term health of the game we all love could be solidified so that future generations of fans would be able to enjoy the game as we current fans do.

Please check back on this site for future articles on how the revised NHL Entry Drafts under a P.D.T. system would have distributed different players to different teams.

Wednesday 27 May 2015

Protected Draft Territory - Summary for the Years 2000 to 2014 – Part2


With the completion of the fifteenth and last article (Protected Draft Territory – Alternate Draft History for the Year 2014) in the series describing the results of implementing a Protected Draft Territory (P.D.T.) for each NHL team and the alternate history for the NHL Entry Drafts that would have resulted, it is now possible to summarize the results and look at whether my suggested solution to rectify the problems with the NHL Entry Draft is a viable one.


In Part 1 of this article, we saw how the first 10 teams fared under the P.D.T. Some teams would have done very well (Toronto), some teams would have done OK, and some teams would not have done so well. In this article, we’ll turn our attention to the middle 10 teams (starting with the NY Islanders) and their results. Looking at Table 1 below things look grim.

Table 1.


Picking up with the eleventh team in the above table, the NY Islanders would have been able to designate a player under their P.D.T. for six of the fifteen years. Here is that list of players:

Table 2.

A closer look at the above table shows that of the four players who have played NHL games, all four had or are having very solid NHL careers. So although the Islanders wouldn’t have had a large quantity of players designated under their P.D.T., their results would have been fairly good. In fact, their results might end up being even better as the jury is still out on what kind of NHL careers the other two players listed for the years 2013 and 2014 might have.

Looking at the results for the 12th team from Table 1. above, it is apparent that the NY Rangers would have fared extremely poorly under the P.D.T.:

Table 3.

Even though it can be said that the jury is still out for Steven Santini in the 2013 spot and perhaps might still be out for Tim Erixon from 2009,  there is only one other player who is having a good if not sold NHL career – Zach Bogosian.

Looking at the results for the 13th team from Table 1. above, it is apparent that even though Chicago would have had almost as many players designated under their P.D.T. as the NY Islanders, their results would have been somewhat worse:

Table 4.

As the jury could still be considered to be out for the two players from the years 2012 and 2013, that leaves three other players. Of those three, two are still active in the NHL. Again, even though their quantity might be lower than other teams, Chicago’s quality is very respectable.

Looking at the results for the 14th team from Table 1. above, it is apparent that the jury would still be out on Anaheim’s P.D.T. picks:

Table 5.


Of the four players above, two saw action in the NHL during the 2014/2015 season – Emerson Etem and Jonathon Blum. The other two players would still be considered works-in-progress.

Looking at the results for the 15th team from Table 1. above, it is apparent that Dallas had much fewer designations under their P.D.T. but would have fared very well in the quality department:

Table 6.


Of the four players, two have turned into good NHL players – Seth Jones and Tyler Myers but the other two players still might develop into solid if not good NHL players.

Looking at the results for the 16th team from Table 1. above, it is apparent that New Jersey would have not fared very well with quantity but would have made up for it with quality under their P.D.T:

Table 7.


Two players – James Van Riemsdyk and Bobby Ryan who are solid NHL players. As well one player taken in 2014 who could still turn into something of significance.

Looking at the results for the 17th team from Table 1. above, it is apparent that Colorado would not have fared very well under the P.D.T.:

Table 8.


Of the three players above, one had a decent if not spectacular NHL career, one was a bust, and the jury is still out on another. Not the kind of results to be expected from a team located in an area that most would consider “friendly” to hockey.

Looking at the results for the 18th team from Table 1. above, it is apparent that even though Winnipeg would not have had the benefit of making designations under the P.D.T. until 2012 (since they only rejoined the league in 2011), they are more than making up for it now:

Table 9.


Even though there are three players listed above, one is turning out to be a solid NHL player while the jury would still definitely be out on the remaining two.

Looking at the results for the 19th team from Table 1. above, it seems that Arizona (Phoenix) has fared very badly under the P.D.T.:

Table 10.


But while the number of players they would have been able to designate under their P.D.T. would have been small, it seems grass-roots hockey is taking hold in the desert and one quality player, with perhaps another on the way,  in the past four years is not a bad return. Of course, we can peak ahead and see that Arizona would absolutely be salivating at the player they would be able to designate under their P.D.T. in 2016 – Auston Matthews – the current consensus 1st overall pick in the 2016 NHL Entry Draft.

Looking at the results for the 20th team from Table 1. above, similar to  Arizona, it seems that Columbus’ results are abysmal. But like Arizona. It seems that Columbus’ trend is heading in the right direction with two players being eligible for designation under their P.D.T. in the past four years:

Table 11.


Of the two players above, one is a solid NHL player while the other is still too early in his development path to know what his NHL career might be.

Looking at the results presented in this article from the middle 10 NHL teams, it is not surprising to see the quantity of players that would have been designated under the P.D.T. declining. But as noted for a few of the teams, what they were lacking in quantity was more than made up for in quality. And most encouraging, the results for a few of the teams is trending in the right direction – up.

In the third and last article in this series, we’ll look at what results the bottom 10 teams would have been able to secure under the P.D.T. and come up with some suggestions on how those results could be improved.